> For the complete documentation index, see [llms.txt](https://zpliu.gitbook.io/booknote/llms.txt). Markdown versions of documentation pages are available by appending `.md` to page URLs; this page is available as [Markdown](https://zpliu.gitbook.io/booknote/svg/01-qi-bu.md).
# 01起步
## D3js-数据可视化神器
最近准备把一些数据可视化一下,打算使用前端的`d3.js`库。这个库的全称也被称为**Data-Driven Document**,顾名思义,基于数据驱动文档,这一概念和Vue的设计思想很类似。`d3.js`下面统称为**D3**;一直以来是神一般的库的存在;尽管已经有许多优秀的库例如百度的`echaet`等;但是**D3**与其他的库相比在于,提供了无限定制的能力,让你的想象力尽情的发挥;在交互性上做的同样优秀。
\~\~感受一波

#### D3的需要的入门知识:
1. SVG
2. css
3. JavaScript
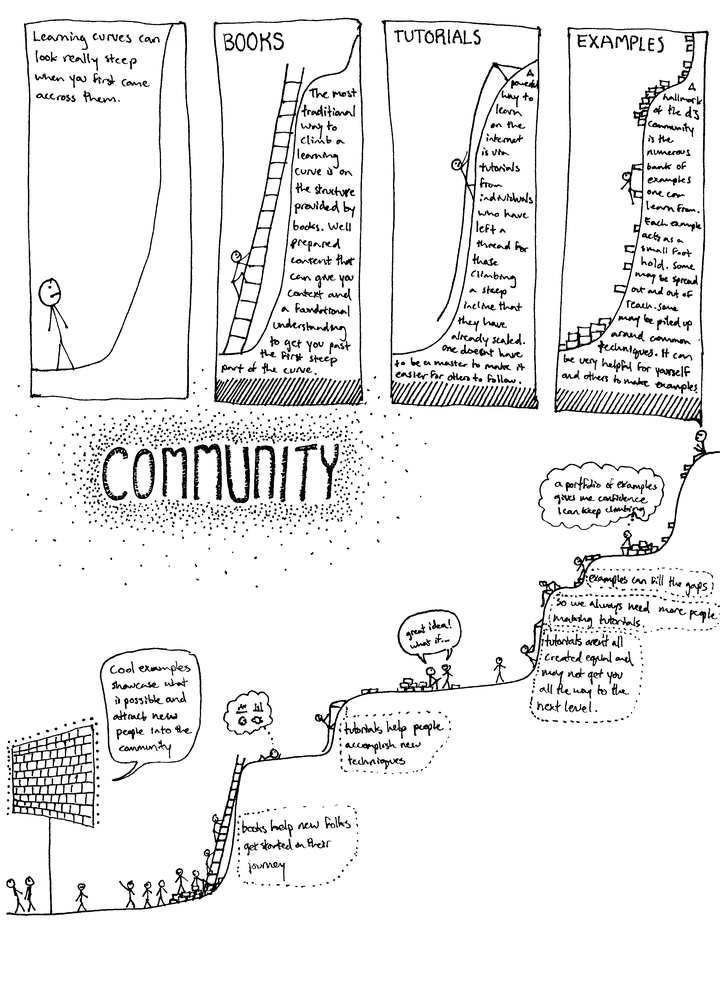
看完大佬们的博客,感觉**D3**的学习成本还是很高的,不过毕竟是神一样的包,肯定涉及到很多知识点,以后慢慢学习的过程查漏补缺吧。下面这张图就把一个学习的过程总结的很好,我觉得太生动了;还是站在巨人的肩膀上,躺着比较舒服,我也喜欢躺。
1. 
## scale vector graphics (SVG)学习
可缩放的矢量图,svg标签内的限制条件
> * 图片必须在`svg`标签内
> * svg指定高度和宽度,也可以使用百分比;继承父元素宽度
> * svg中可以绘制多个图片
svg中可使用预先设置好的一系列标签;
* 矩形 `rect`
* 圆形`circle`
* 椭圆 `ellipse`
* 线 `line`
* 折线 `polyline`
* 多边形 `polygon`
* 路径 `path`
### 快速生成一个圆
* 使用`circle`标签表示生成圆形
* `cx|cy`圆心的位置,不指定则为0,0
* `stroke`外圆边框颜色及厚度
```javascript
```
### 快速生成一个矩形
* width 矩形长
* height 矩形宽
* stroke 矩形边框
* stroke-width 矩形边框宽度
* style 指定矩形样式
```javascript
```
### 快速生成一个椭圆
* rx 定义水平半径
* ry 定义垂直半径
```javascript
```
### 快速生成一个线条
* x1 和x2 x轴的开始和结束
* y1和y2 y轴的开始和结束
```javascript
```
### 快速生成一个多边形
定义了6个角的位置,将会生成一个三角形
* points 定义了每个角的坐标轴位置
```javascript
```
#### 快速生成一个折线图
* points同样定义了每个折点的坐标
* fill 这个填充区域还有点迷惑
```javascript
```
### 快速生成一个路径图
从250,150出发,到150,350;再到350,350;最后回到原点,生成了一个三角形。
> 推荐使用SVG编辑器来编辑路径图
```javascript
```
### 参考
1. [SVG](https://www.w3school.com.cn/svg/index.asp)
2. [d3js](https://juejin.im/post/5d1e074af265da1bca51f8ec)
3. [D3学习之路-知乎](https://zhuanlan.zhihu.com/p/38001672)